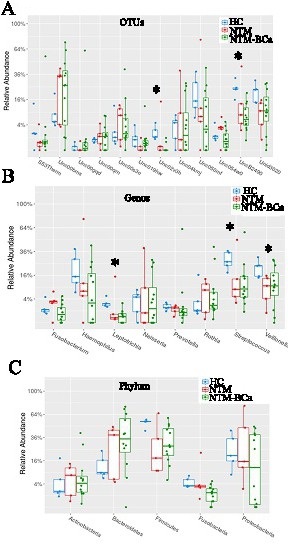
Fig. 3. Taxa distribution in the sputa of various groups. (A) Distribution pattern of the Operational Taxonomic Units (OTUs) across various groups. Compared to the HC group, the OTUs, Unc02v3h and UncB2490 were significantly lower in the NTM-BCa group (p=0.007-0.017). No significant difference was observed in the OTU distribution between HC vs. NTM (p=0.06-0.08) or NTM vs. NTM-BCa groups (p=0.9-0.1). (B) Significantly lower abundance of Leptotrichia (0.4% vs. 2.8%, p=0.006) and Streptococcus (13% vs. 28%, p=0.01) in the BCa-NTM group compared to the HC subjects. Abundance of genus Veilonella was significantly lower in the NTM group compared to the HC group (9% vs. 21%, p=0.03). No considerable difference in genera distribution between the NTM and NTM-BCa groups (p=0.16-0.95). A minimum average abundance of 1% was considered. (C) At the phyla level, the majority of the taxa in the HC group belonged to Firmicutes (52%) Proteobacteria (24%) and Bacteriods (13%). Compared to the HC, the top phyla in the NTM group were Proteobacteria (28%), Firmicutes (27%) and Bacteriods (13%). In the NTM-BCa group the top phyla were Bacteriods (36%), Firmicutes (33%) and Proteobacteria (19%). The phyla Firmicutes and Fusobacteria were dominant (p=0.04) in the HC compared to the NTM-BCa group. No considerable difference in the distribution of phyla was observed between the HC vs. NTM or the NTM vs. NTM-BCa groups (=0.29-0.80). HC: Healthy controls; NTM: Women with NTM lung disease only; NTM-BCa: Women with both NTM lung disease and breast cancer.